Observability
JobRunr Pro integrates with your observability platform to make sure all your jobs keep running like clockwork
Although the JobRunr Pro Dashboard gives instant insights how your jobs are doing, you may already have an observability platform like Jaeger, HoneyComb or New Relic running. JobRunr Pro out-of-the box integrates with many of these observability platforms so you can keep on top of things.
Micrometer Job Timings
JobRunr can be easily configured to export metrics such as the total amount of succeeded jobs. In addition, JobRunr Pro can export the average job duration, maximum job duration and other metrics like job failure count per job. This allows you to reuse your existing tools like Prometheus, Grafana, … and be notified by your existing alerting platform in case things go south.
Configuration
You can easily enable these timings in Spring Boot, Micronaut and Quarkus using your existing configuration:
# enable general jobs metrics and integrate with your framework
jobrunr.jobs.metrics.enabled=true
# enable job timing metrics (Pro only)
jobrunr.jobs.metrics.micrometer-timers.enabled=true
After enabling micrometer-timers, the following metrics will be exposed:
- A counter of all job runs:
jobrunr.jobs.runs.total. - A long task timer
jobrunr.jobs.in-progressto follow jobs in processing. - A timer reporting the execution time of succeeded jobs:
jobrunr.jobs.runs.succeeded. - A timer reporting the execution time of succeeded batch jobs:
jobrunr.batch-jobs.runs.succeeded. - A timer reporting the execution time of failed jobs:
jobrunr.jobs.runs.failed. - A timer reporting the execution time of failed batch jobs:
jobrunr.batch-jobs.runs.failed. - A gauge of the number of failed jobs:
jobrunr.jobs.failures.
The above meters include tags (aka labels) populated from each executed job.
Observability
You can also integrate JobRunr with your observability platform thanks to OpenTelemetry and Micrometer.
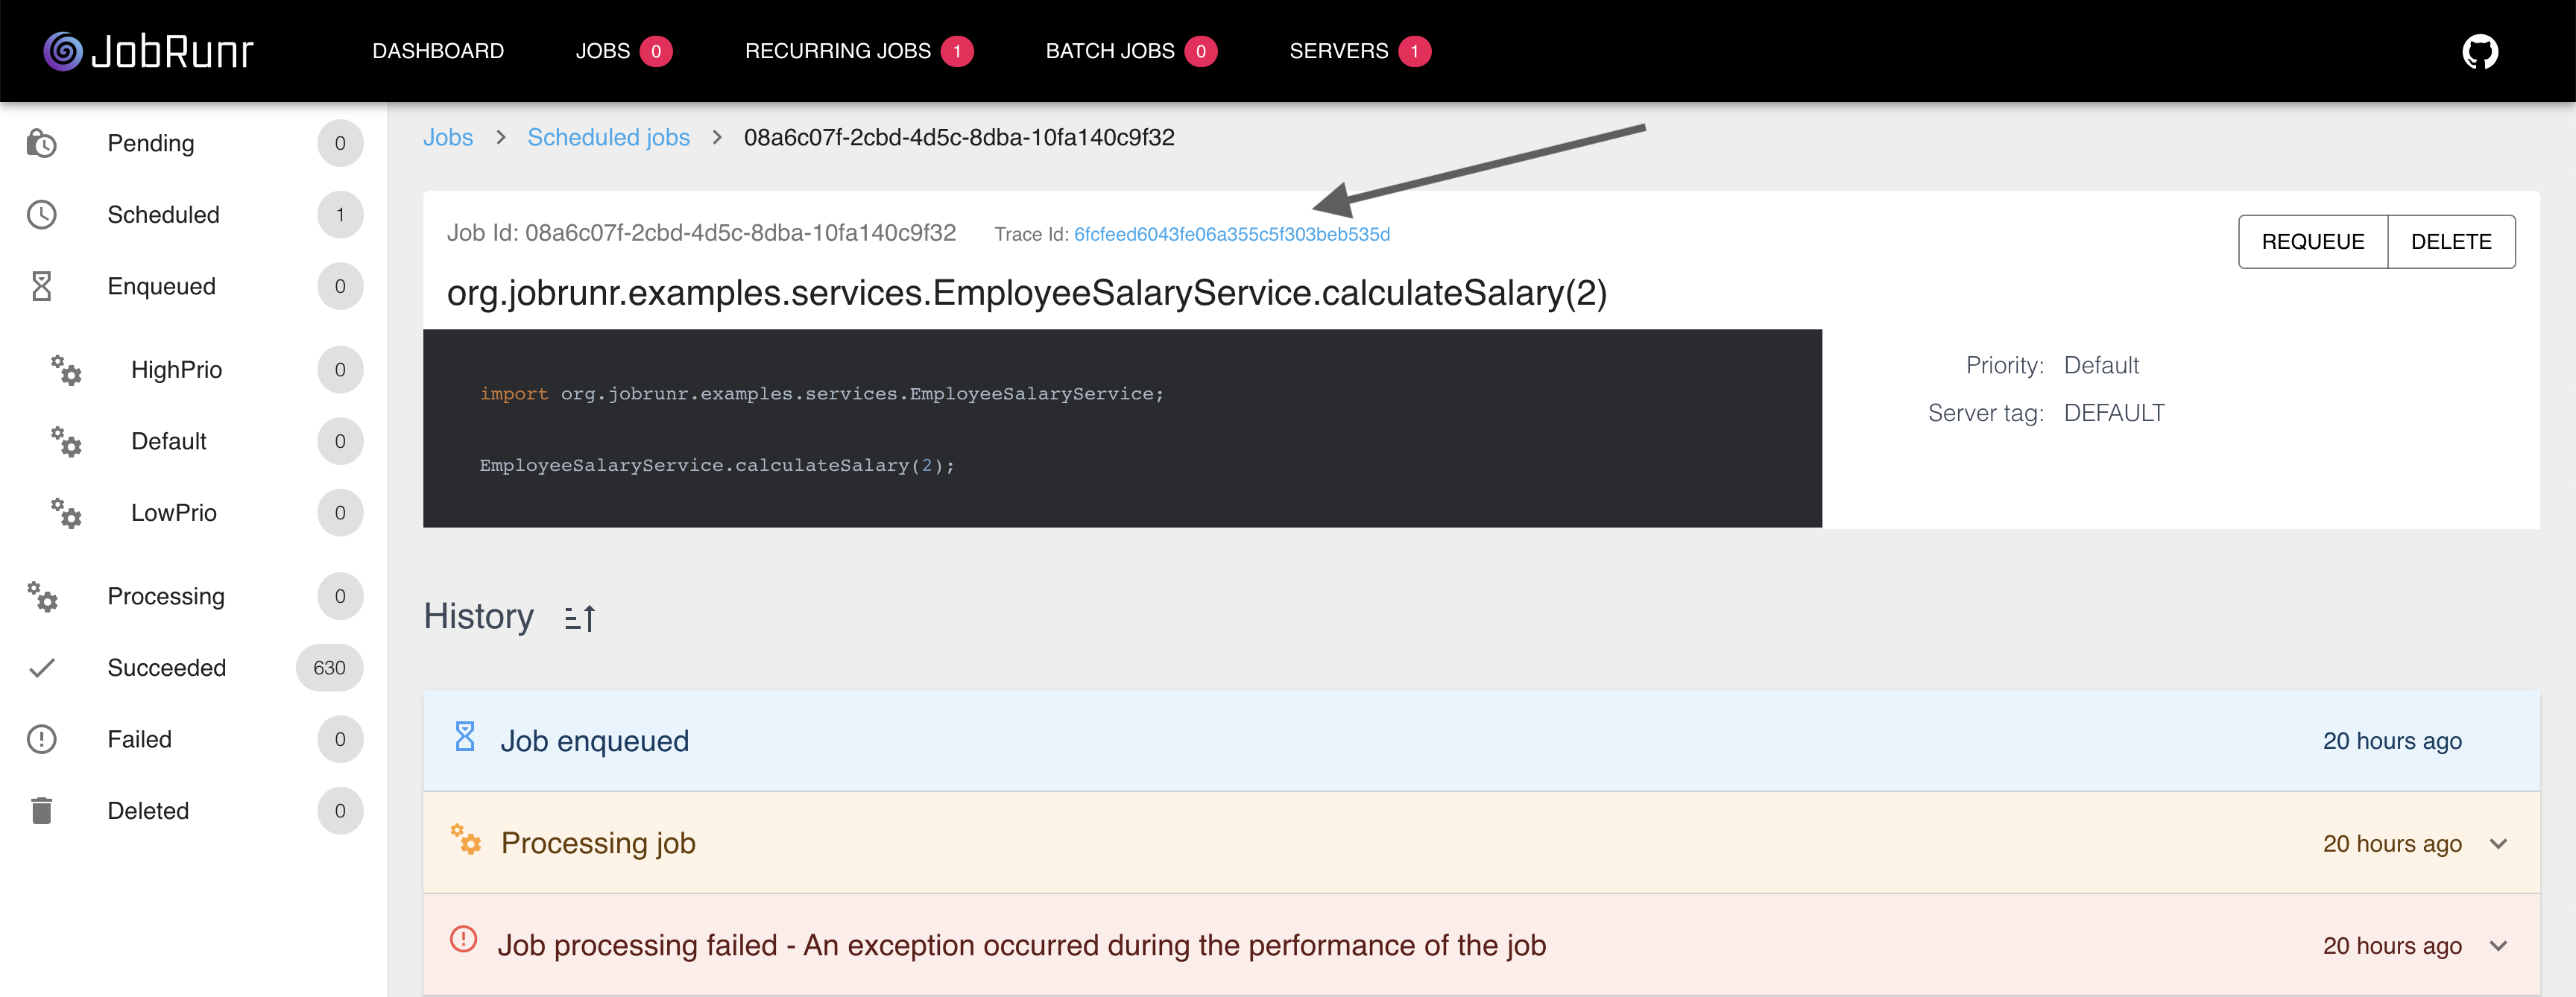
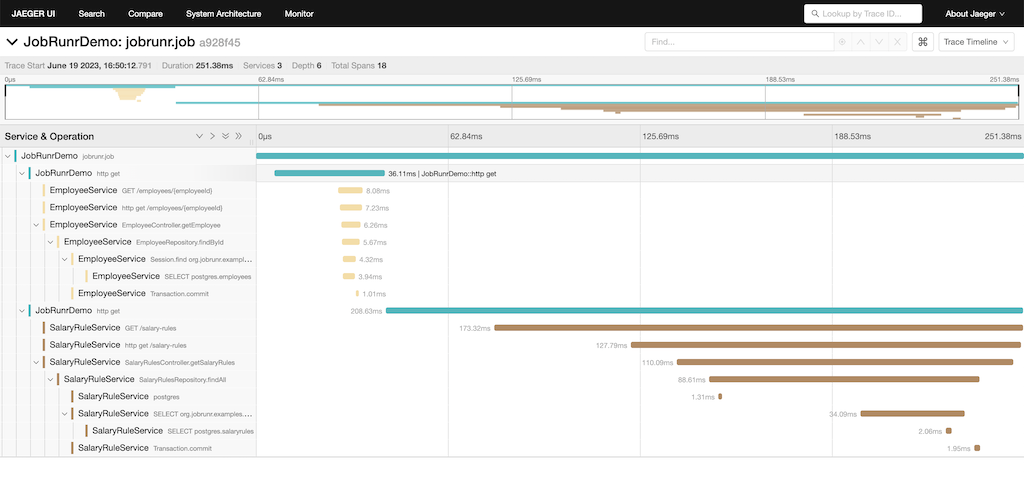
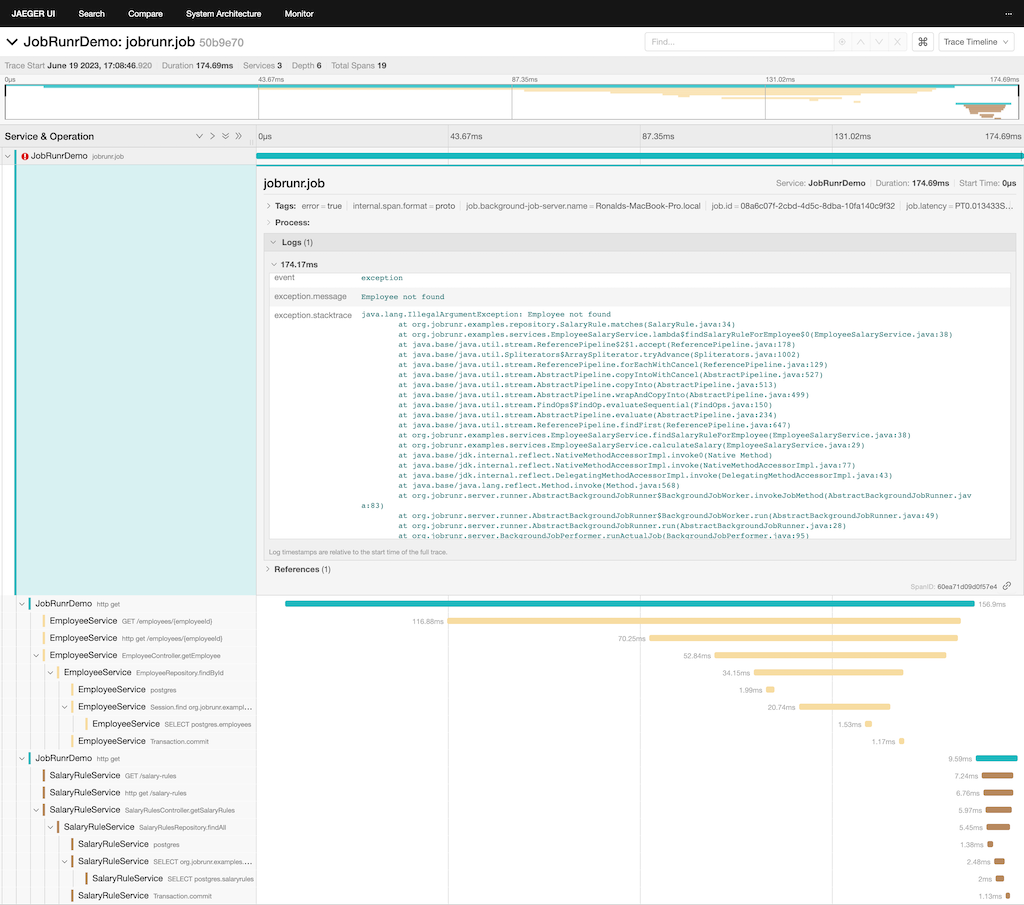
Using the integration of your choice will not only show you the TraceId within the JobRunr Pro Dashboard but it will also show detailed job information in your observability platform.


Configuration
You can easily enable observability in Spring Boot, Micronaut and Quarkus using your existing configuration:
# enable linking from within the JobRunr Pro Dashboard to your Tracing Provider
jobrunr.dashboard.integrations.observability.jaeger.root-url=http://localhost:16686/

# if you prefer Micrometer
jobrunr.jobs.metrics.micrometer-observability.enabled=true

# or, if you prefer OpenTelemetry
jobrunr.jobs.metrics.otel-observability.enabled=true
