Dashboard
The built-in dashboard gives you helpful insights into your background jobs
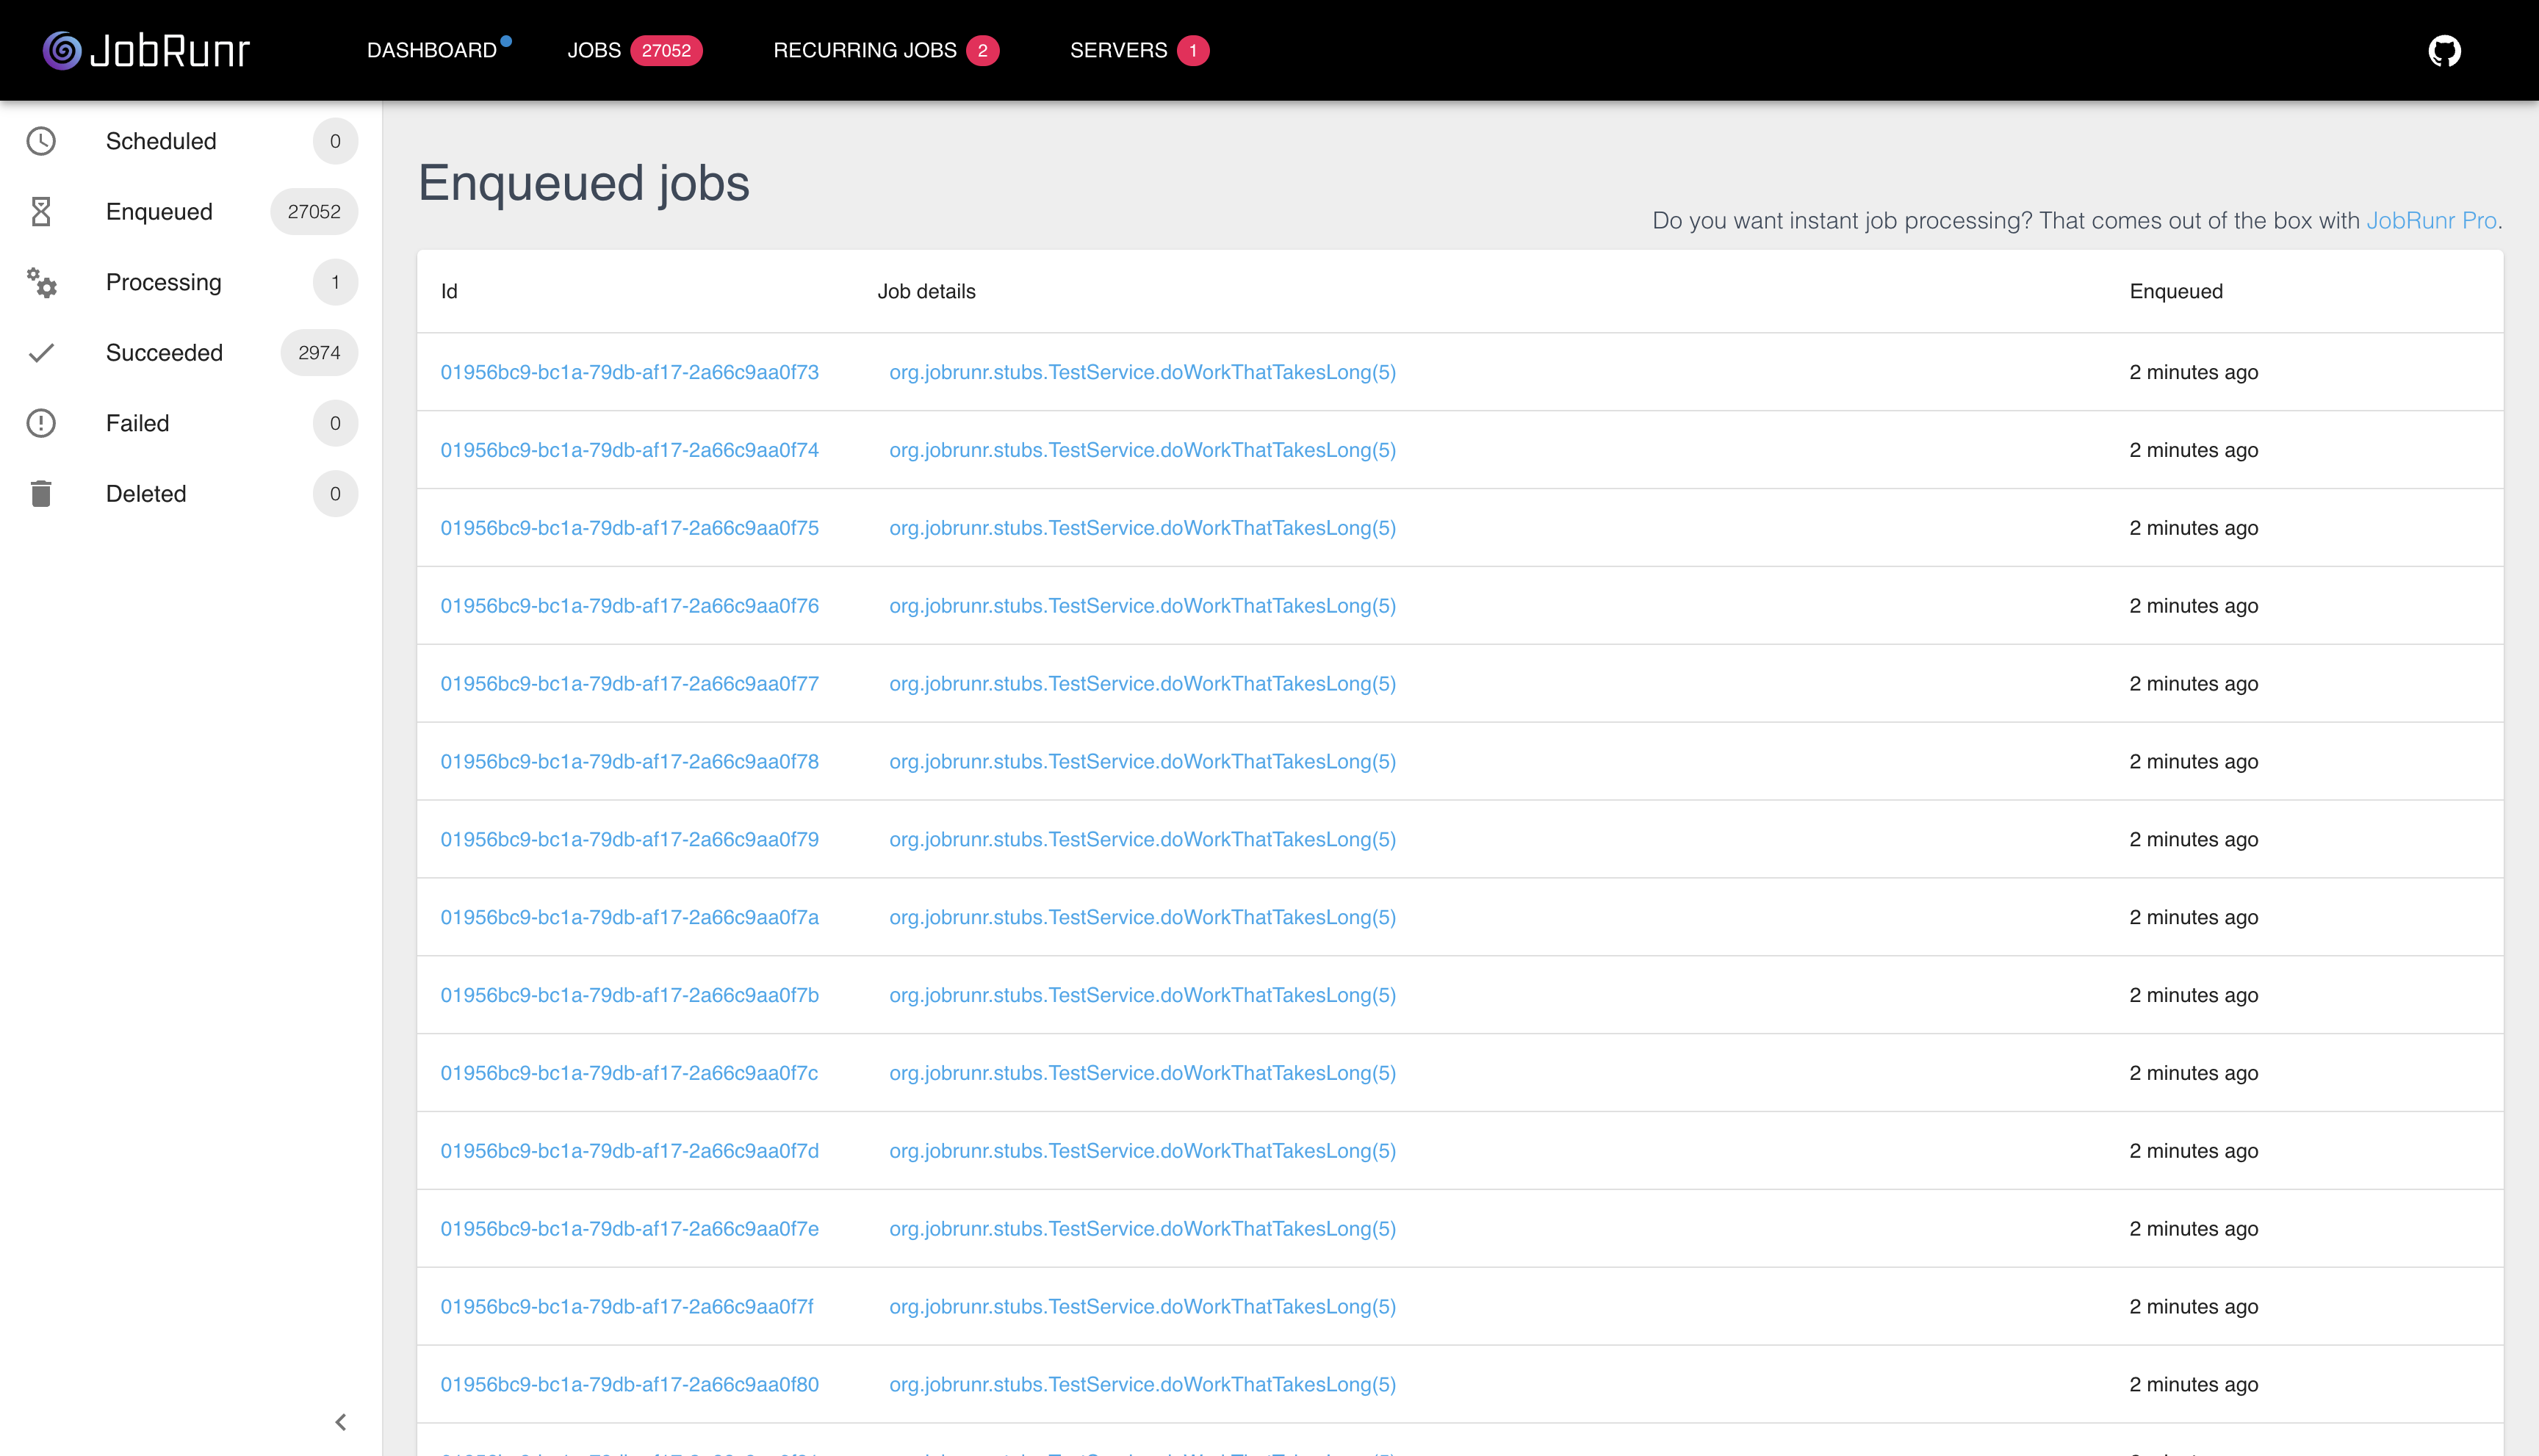
JobRunr includes a built-in dashboard which gives helpful insights into your background job methods. The dashboard allows you to see and control any aspect of background job processing - you have a detailed view on any exception that occurred and you can see the complete background job history.
By default, it is available on the following url: http://localhost:8000. Of course, this is configurable:
Using fluent configuration
    JobRunr.configure()
        .useDashboard(8000)
Using Spring configuration
org.jobrunr.dashboard.enabled=true
org.jobrunr.dashboard.port=8000
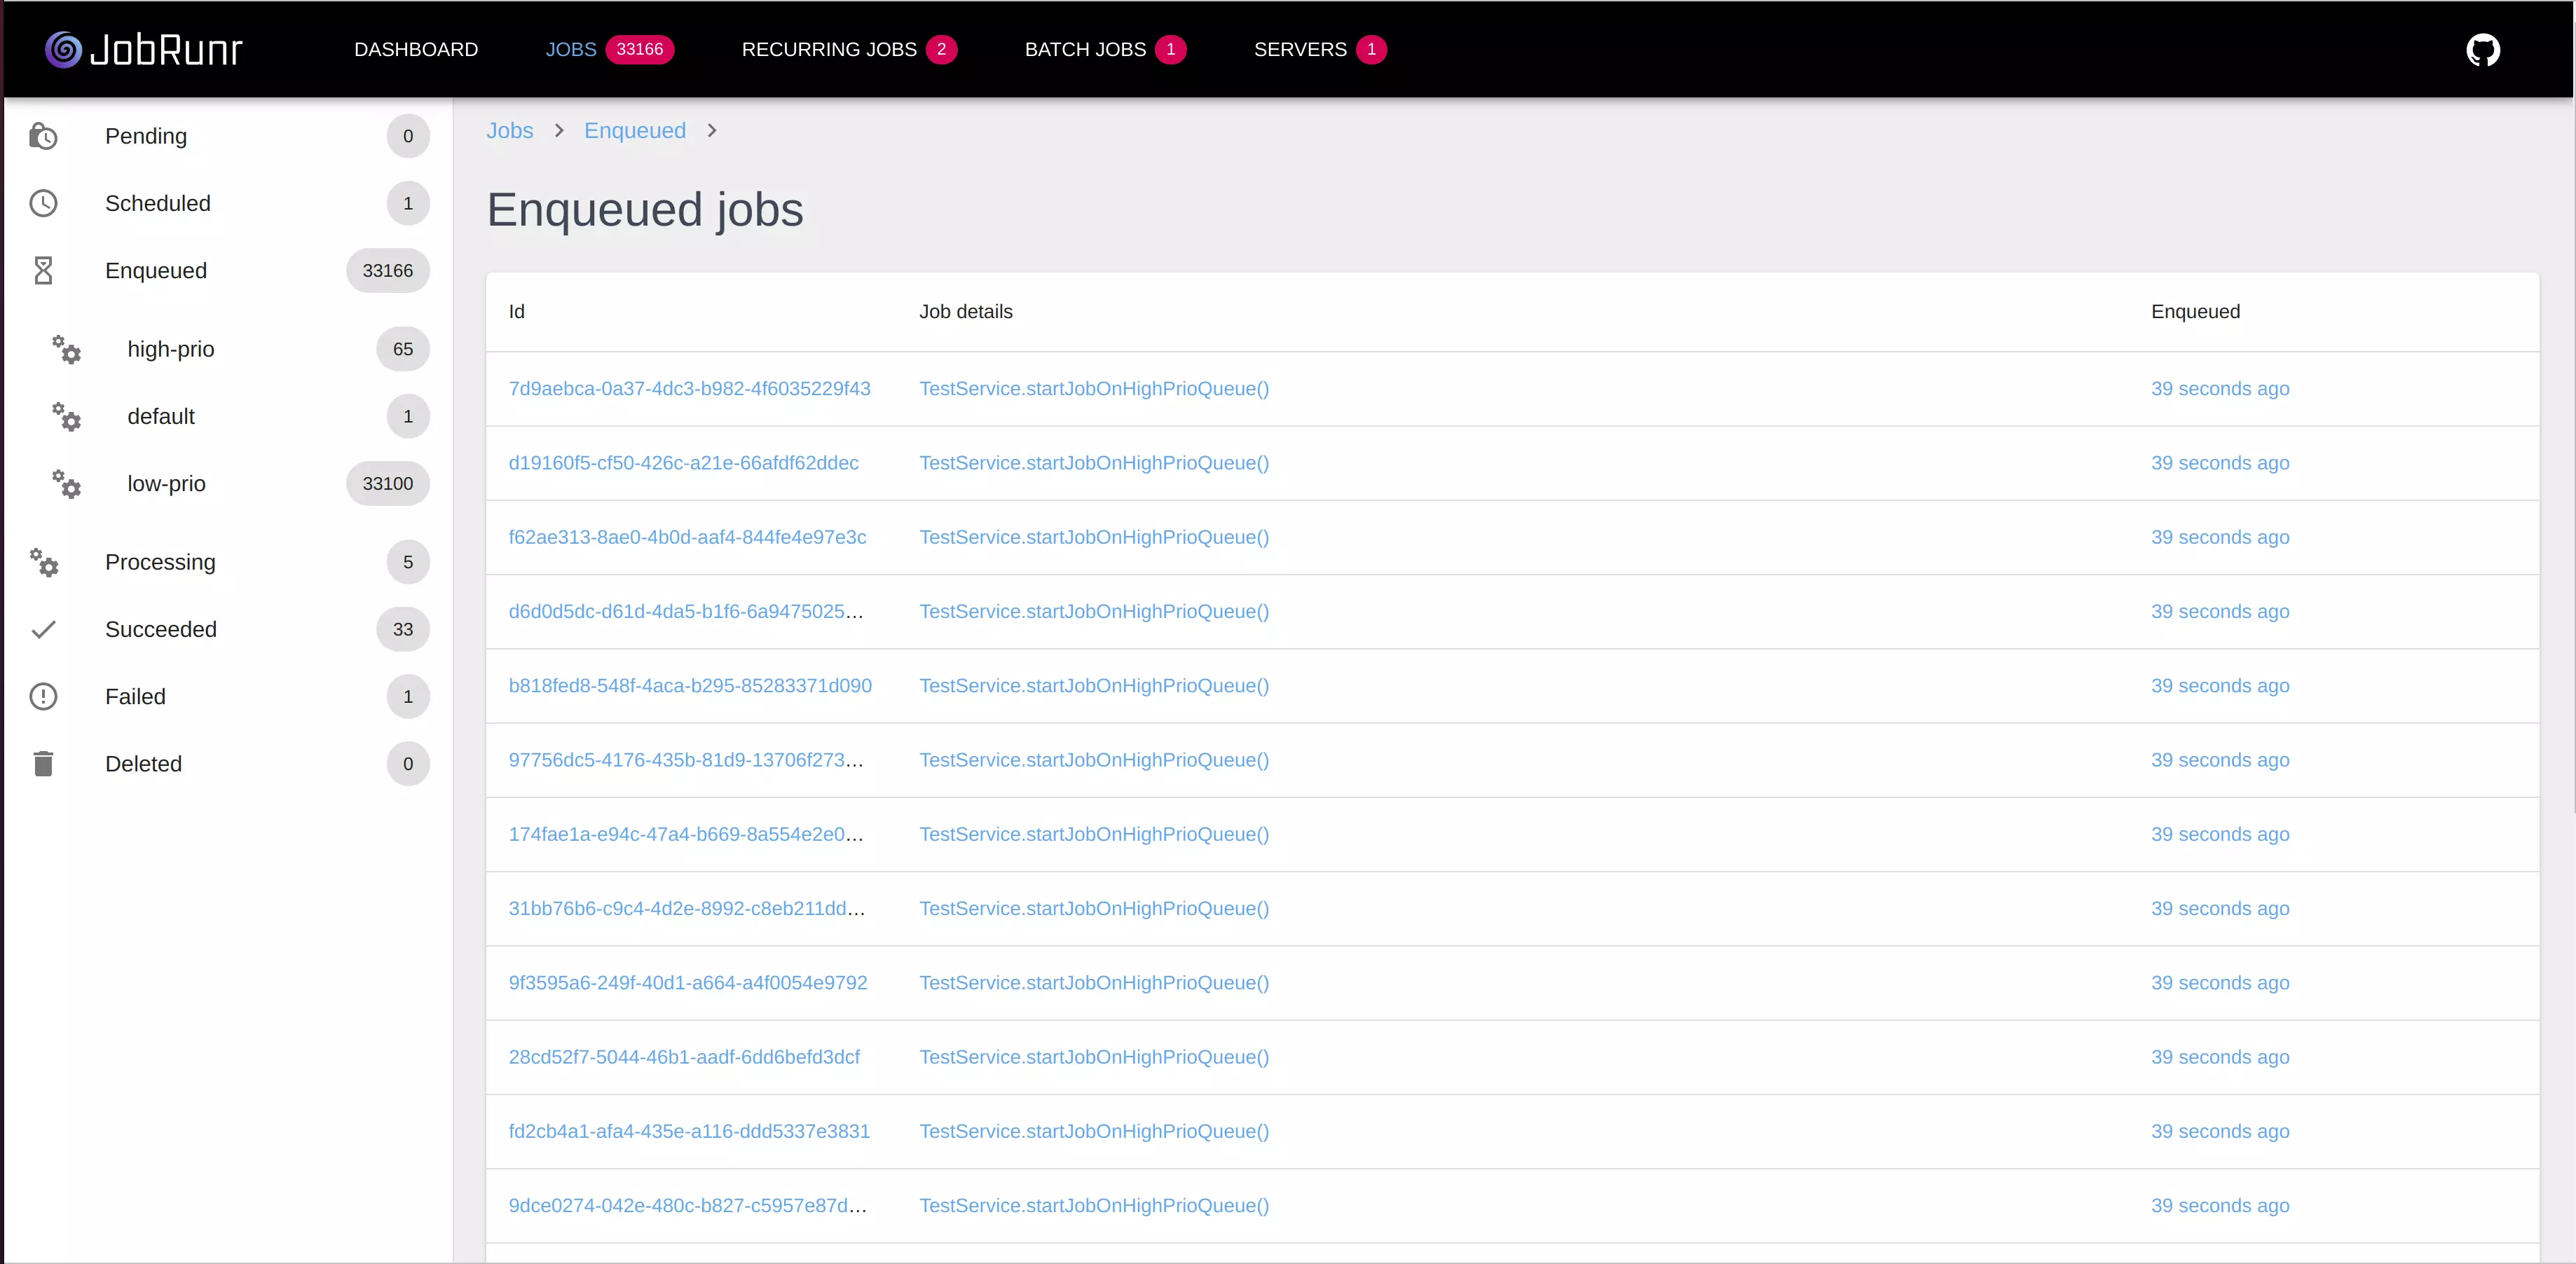
Do you want a more powerful dashboard with authentication, configurable context path or even embedded within Spring, Micronaut or Quarkus? Then have a look at the JobRunr Pro Dashboard!
Readable Job Names thanks to the @Job annotation or the JobBuilder
You can easily configure your Job Name and some Job Labels for the dashboard by means of the @Job annotation:
@Job(name = "Sending email to %2 (requestId: %X{request.id})", labels = {"tenant:%0", "email"})
public void sendEmail(String tenant, String from, String to, String subject, String body) {
    // business code here
}
These properties support parameter substitution. In the example above, %2 will be replaced with the `to` parameter. You can also access the SLF4J Mapped Diagnostic Context (see %X{request.id}).
The same is also possible for labels.
This is of-course also possible using the JobBuilder pattern:
jobScheduler.create(aJob()
    .withName("Sending email to " + to)
    .withLabels("tenant:" + tenant, "email")
    .withDetails(() -> emailService.sendEmail(tenant, from, to, subject, body)))
Screenshots


JobRunr Pro comes with handy dashboard improvements


